

%20Analyses%201.png "NetAlytics Upstream Network (Trunk Mains Areas) Analyses")
%20Total%20Leakage%201.png "NetAlytics Downstream Network (district areas) Total Leakage")
%20Total%20Leakage%202.png "NetAlytics Downstream Network (district areas) Total Leakage")
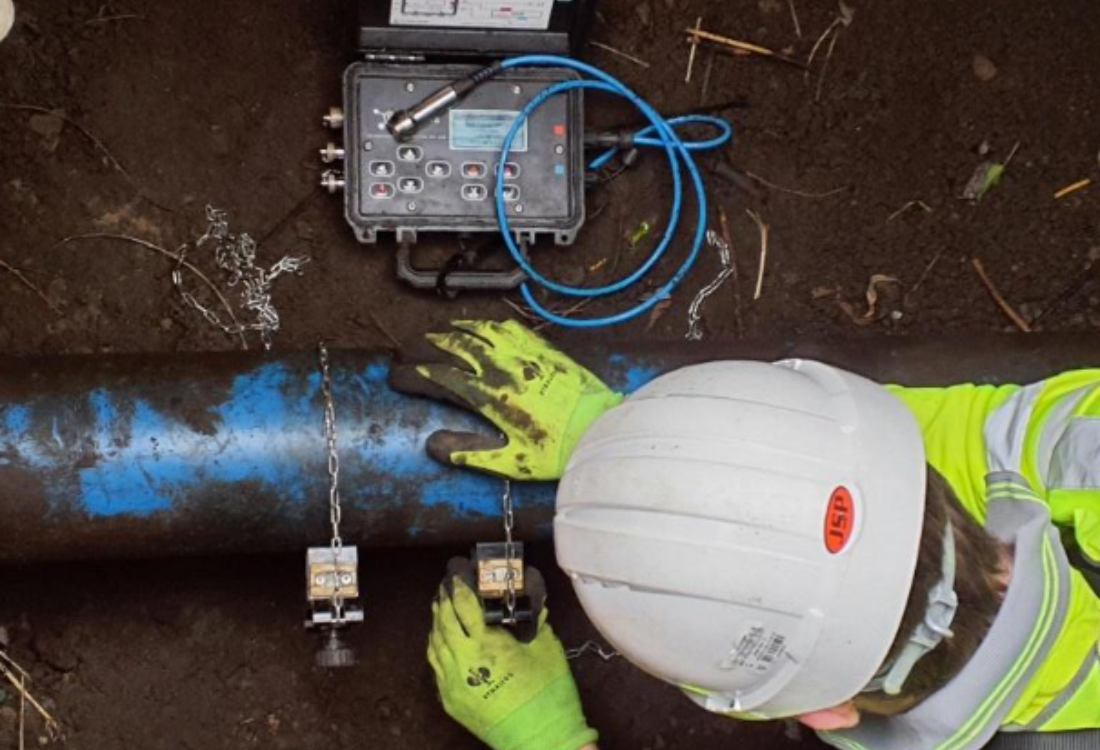
In the ongoing challenge to reduce water loss and improve network efficiency, technology plays a critical role. At Crowder, we believe in leveraging the best tools available to find more leaks,...
6 June 2025
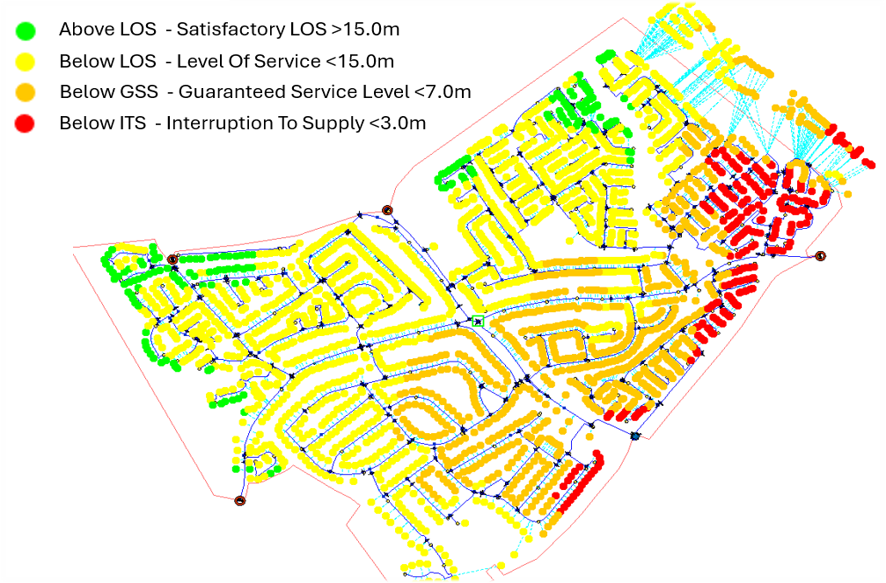
We recently hosted a four-part Interruptions to Supply (ITS) webinar series with our UK and Ireland water industry clients to showcase the development of our solutions which leverage network and time...
29 May 2025
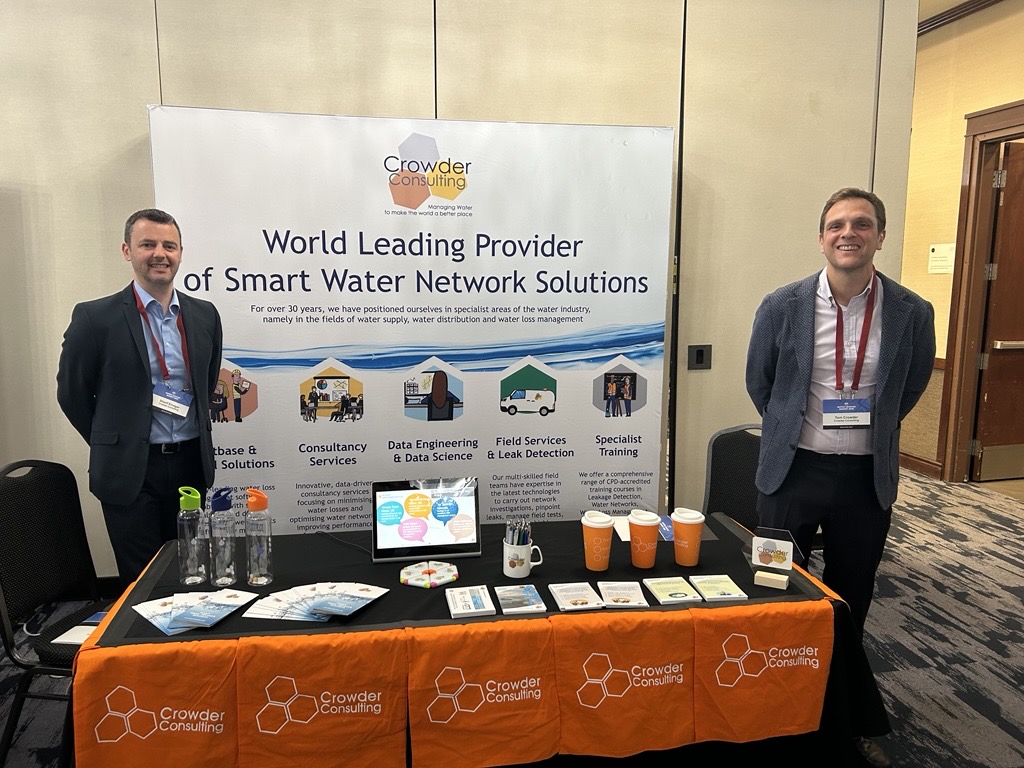
We had the privilege of attending the Water Leakage Summit in Calgary, Canada, held on May 12–13, where industry leaders gathered to explore the latest developments in water loss management.
16 May 2025